MRR
SaaSIntermediateFree during launchInstant downloadStarter KitNext.js Source3 screens includedStates includedPreview SVGsSchemaLicenseDashcipe Quality StandardFigma import kitDark mode included
SaaS Subscription Dashboard
A subscription starter kit for MRR, churn, and trial conversion.
60 minNext.js / Tailwind / RechartsSaaS founder or RevOps owner
Recipe Workspace
Preview the layout, understand the KPIs, copy the starter
Review the dashboard at a practical desktop ratio first, then use the KPI rationale, code starter, and AI IDE prompt below.
Live Recipe Preview
SaaS Subscription Dashboard
A subscription starter kit for MRR, churn, and trial conversion.
Starter Kit availableOpen live view
Live Recipe
SaaS Subscription Dashboard
A subscription starter kit for MRR, churn, and trial conversion.
Finance terminaldensesidebarasset cardsallocation chartcashflow table
18,420+8.2%
Churn
Trial conversion
Expansion MRR
MRR trend
VisxRisk Ledger
Chart.js118,420
MRR
Sample data
234.8%
Churn
Sample data
3$84.2K
Trial conversion
Sample data
Watch List
MRRWatch
ChurnWatch
Trial conversionWatch
Detail Table
MRR
Sample data
18,420
상태Churn
Sample data
34.8%
상태Trial conversion
Sample data
$84.2K
상태Top
Four KPI cards
Middle
Primary trend and segment view
Bottom
Priority table and alerts
KPI Ingredients
MRR
MRR belongs in the primary row when an owner can act on it this week.
Alternative KPI: MRR segment
Churn
Churn belongs in the primary row when an owner can act on it this week.
Alternative KPI: Churn segment
Trial conversion
Trial conversion belongs in the primary row when an owner can act on it this week.
Alternative KPI: Trial conversion segment
Expansion MRR
Expansion MRR belongs in the primary row when an owner can act on it this week.
Alternative KPI: Expansion MRR segment
Code Starter
Copy component starter
const metrics = [
  { label: "MRR", value: "18,420", change: "+8.2%" },
  { label: "Churn", value: "34.8%", change: "+2.1%p" },
  { label: "Trial conversion", value: "$84.2K", change: "+12.4%" }
];

export function SaasSubscriptionDashboardPreviewCards() {
  return <section className="grid gap-3 md:grid-cols-3">{metrics.map((metric) => <article key={metric.label} className="rounded-xl border border-zinc-200 bg-white p-4"><p className="text-xs font-bold text-zinc-500">{metric.label}</p><strong className="mt-1 block text-2xl font-black">{metric.value}</strong><span className="text-xs font-black text-emerald-600">{metric.change}</span></article>)}</section>;
}
AI IDE Prompt
Paste into your AI IDE
Create a SaaS Subscription Dashboard. Put KPI cards for MRR, Churn, Trial conversion, Expansion MRR, trend and segment charts, a priority table, and empty/loading/error states.
Bundle Preview
3 screens included
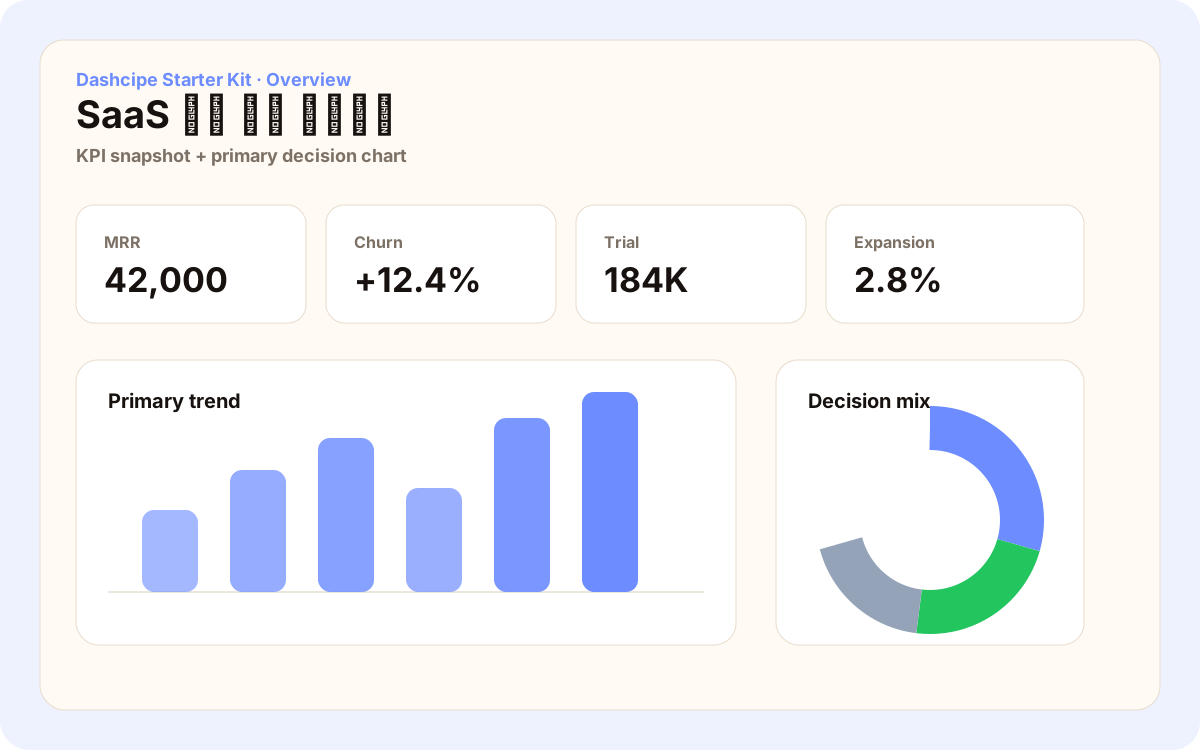
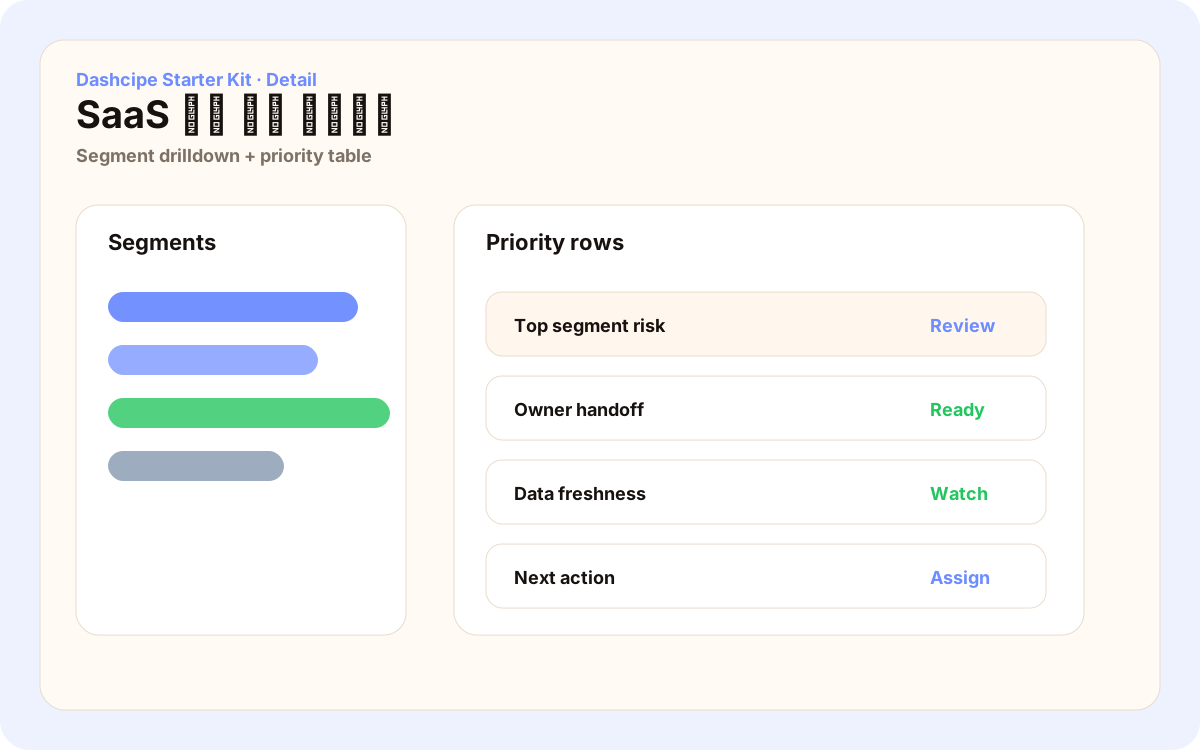
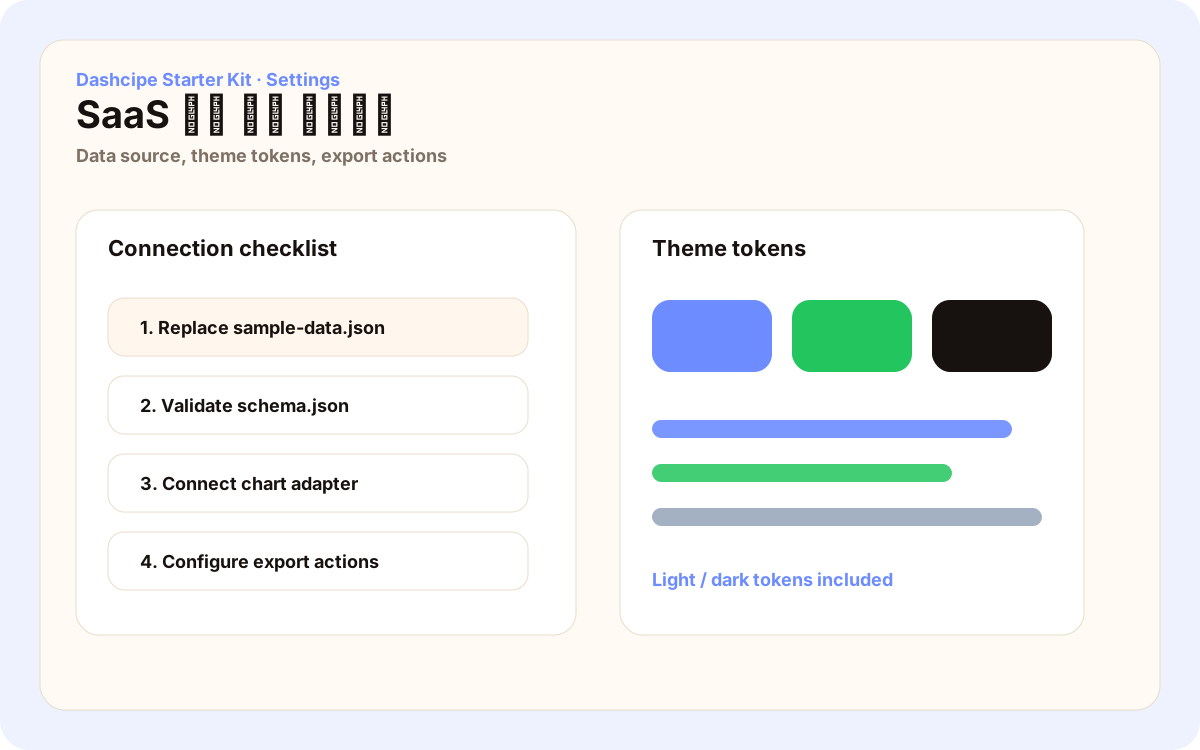
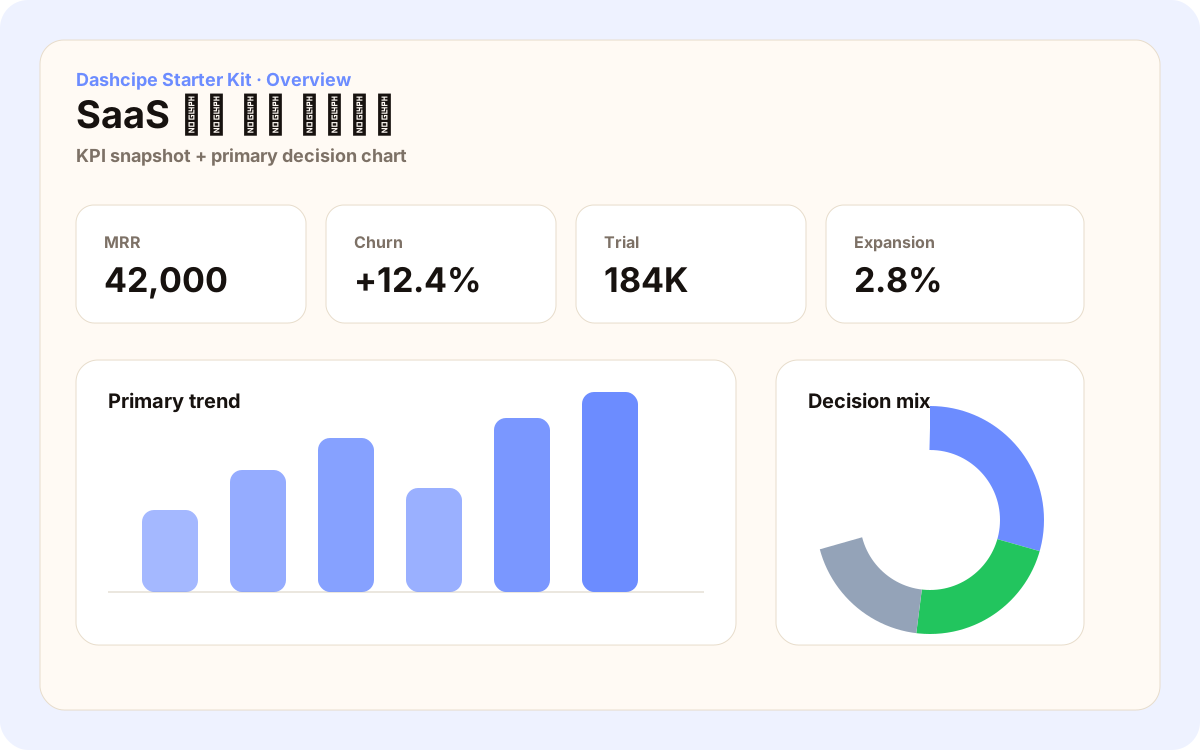
Preview the overview, detail, and settings screens as SVG before downloading the ZIP source.
Decision System
Why this dashboard should exist before it is designed
AdSense-quality pages need original explanation, not only screenshots. This section documents the decision, data model, failure patterns, and implementation alternatives.
Operating decision
SaaS Subscription Dashboard answers this operating question: Is growth driven by new revenue, lower churn, or better pricing?. The primary row is not a vanity summary; it decides what an owner should do this week.
The recipe is designed for SaaS founder or RevOps owner, Early product builders who need to choose data definitions, chart priority, and bottom-row actions quickly.
Data sources and event definitions
- Stripe events, subscription table, CRM lifecycle status
Before implementation, define event names, owner, refresh cadence, and missing-data behavior for each source.
Required KPIs and removal rules
MRR
MRR belongs in the primary row when an owner can act on it this week.
Alternative or removal signal: MRR segment
Churn
Churn belongs in the primary row when an owner can act on it this week.
Alternative or removal signal: Churn segment
Trial conversion
Trial conversion belongs in the primary row when an owner can act on it this week.
Alternative or removal signal: Trial conversion segment
Expansion MRR
Expansion MRR belongs in the primary row when an owner can act on it this week.
Alternative or removal signal: Expansion MRR segment
Common failure patterns
Treat isolated movement in MRR as a signal to inspect data definitions or operating bottlenecks.
Treat isolated movement in Churn as a signal to inspect data definitions or operating bottlenecks.
Treat isolated movement in Trial conversion as a signal to inspect data definitions or operating bottlenecks.
Treat isolated movement in Expansion MRR as a signal to inspect data definitions or operating bottlenecks.
Alternative layout
For an MVP, keep Four KPI cards. As data matures, expand Primary trend and segment view into segment comparison or cohort analysis.
Implementation Blueprint
KPI audit protocol before implementation
Use this table before designing the UI. Without a formula, review cadence, and action trigger, a dashboard can look polished but still fail to support an operating meeting.
KPIFormulaReview cadenceAction trigger
MRR
MRR = source event aggregate / comparison baseline. Start segmentation by MRR segment.
Daily morning
If MRR moves more than 10% week over week, inspect the causal segment and action table together.
Churn
Churn = source event aggregate / comparison baseline. Start segmentation by Churn segment.
Weekly review
If Churn moves more than 10% week over week, inspect the causal segment and action table together.
Trial conversion
Trial conversion = source event aggregate / comparison baseline. Start segmentation by Trial conversion segment.
After campaign end
If Trial conversion moves more than 10% week over week, inspect the causal segment and action table together.
Expansion MRR
Expansion MRR = source event aggregate / comparison baseline. Start segmentation by Expansion MRR segment.
Monthly report
If Expansion MRR moves more than 10% week over week, inspect the causal segment and action table together.
Event and table starter
When starting from an AI IDE, lock event and table names first. It makes generated components and queries much more consistent.
saas_subscription.viewed
Source event for MRR. Keep owner, occurred_at, segment_key, value, and source_system as baseline fields.
saas_subscription.converted
Source event for Churn. Keep owner, occurred_at, segment_key, value, and source_system as baseline fields.
saas_subscription.risk_flagged
Source event for Trial conversion. Keep owner, occurred_at, segment_key, value, and source_system as baseline fields.
saas_subscription.resolved
Source event for Expansion MRR. Keep owner, occurred_at, segment_key, value, and source_system as baseline fields.
Weekly review sequence
- 1Separate whether the MRR movement is a real operating issue or short-term noise.
- 2Read it with Churn to narrow the cause to acquisition, conversion, quality, or throughput.
- 3Use the bottom table to choose one owner, one segment, and one action for this week.
- 4At the next review, adjust the layout based on recovery after the action, not on the same chart alone.
Frequently asked questions
Which KPIs should SaaS Subscription Dashboard prioritize?
SaaS Subscription Dashboard should prioritize MRR, Churn, Trial conversion, Expansion MRR. Keep MRR in the primary row only when an owner can act on it this week.
What data sources are required?
Stripe events, subscription table, CRM lifecycle status are the baseline sources. Define event names, refresh cadence, owner, and missing-data behavior before implementation.
Can this layout be used for an MVP?
For an MVP, start with Four KPI cards and Primary trend and segment view. Add bottom tables and alerts when operating actions become clear.
Which metrics should be removed?
Remove metrics that cannot trigger an action within one weekly review cycle, have unstable definitions, or behave like vanity metrics without adjacent context.
How should the AI IDE prompt be used?
Use the prompt as a starting point, then add real field names, table names, state UI requirements, and accessibility requirements for your project.
Market Pattern
Marketplace-proven dashboard pattern, rewritten for Dashcipe
This section documents the public preview pattern behind the layout and how Dashcipe changes it into original KPI guidance.
finance-terminal-plus / dark
asset cardsallocation chartcashflow tablerisk feed
Observed pattern
Finance templates use dark terminals, asset cards, allocation charts, and transaction/cashflow tables for trust.
Dashcipe adaptation
Dashcipe maps that to MRR, portfolio, invoice, and donation risk decisions.
Originality guard
Only the generic financial information structure is referenced, not any specific color system or component design.
Free Resources
What you can use for free
Use the KPI logic, layout, code starter, prompt, Figma SVG, schema, and tokens directly.
downloadZIPdesignFigma SVGdataSchemadesignTokensDashcipe Quality StandardResponsive QASchemaFigma SVGLicenseChangelog
Starter Kit Files
What's inside this bundle
- overview.html
- detail.html
- settings.html
- src/page.tsx
- src/components
- src/data/sample-data.ts
- data/schema.json
- tokens.json
Compatibility
Built for fast implementation
- Next.js App Router
- Tailwind CSS
- Static HTML preview
- Figma SVG import
Implementation time: 35 min
Quality Checklist
Market-ready signals
- 3 production-style screens
- Reusable TSX components
- Empty/loading/error states
- Light/dark tokens
- Schema-backed sample data
Use this recipe when
- The vertical metrics are already roughly known
- You need to prioritize charts and tables quickly
Skip this recipe when
- No events or data definitions exist yet
- You only need a marketing landing page
Expert Notes
How a real operator should read these KPIs
These notes turn each metric into an operating decision, data source, and removal rule.
SaaS founder or RevOps owner
- Why it matters
- MRR is not a vanity number; it decides the next operating action.
- Failure signal
- Treat isolated movement in MRR as a signal to inspect data definitions or operating bottlenecks.
- Data source
- Stripe events, subscription table, CRM lifecycle status
- When to remove
- Remove it from the primary row if no owner can act within one weekly review cycle.
SaaS founder or RevOps owner
- Why it matters
- Churn is not a vanity number; it decides the next operating action.
- Failure signal
- Treat isolated movement in Churn as a signal to inspect data definitions or operating bottlenecks.
- Data source
- Stripe events, subscription table, CRM lifecycle status
- When to remove
- Remove it from the primary row if no owner can act within one weekly review cycle.
SaaS founder or RevOps owner
- Why it matters
- Trial conversion is not a vanity number; it decides the next operating action.
- Failure signal
- Treat isolated movement in Trial conversion as a signal to inspect data definitions or operating bottlenecks.
- Data source
- Stripe events, subscription table, CRM lifecycle status
- When to remove
- Remove it from the primary row if no owner can act within one weekly review cycle.
SaaS founder or RevOps owner
- Why it matters
- Expansion MRR is not a vanity number; it decides the next operating action.
- Failure signal
- Treat isolated movement in Expansion MRR as a signal to inspect data definitions or operating bottlenecks.
- Data source
- Stripe events, subscription table, CRM lifecycle status
- When to remove
- Remove it from the primary row if no owner can act within one weekly review cycle.
Recipe Flow
Move through recipes without returning to the list
Related Recipes
Similar dashboard recipes
Recipes from the same category or stack.
bootstrap-analytics
Free resourceBeginner
AdMob Revenue Dashboard
Is a revenue drop caused by traffic, pricing, or placement?
Free downloadQuality checkedStarter KitNext.js3 screensSchemaFigma SVGNext.jsTailwindChart.js
Market patternbootstrap-analytics
Layout: topbarSurface: lightstat cardsbar chart
enterprise-suite
Free resourceIntermediate
GA4 App Analytics Dashboard
Where do users come from, convert, or drop off?
Free downloadQuality checkedStarter KitNext.js3 screensSchemaFigma SVGNext.jsTailwindRecharts
Market patternenterprise-suite
Layout: splitSurface: hybridKPI rowtrend chart
ops-workbench
Free resourceBeginner
Play Console Operations Dashboard
Where does store quality change appear first?
RequestableHTMLTailwindChart.js
Market patternops-workbench
Layout: sidebarSurface: darkstatus wallmap/list panel